17-Echarts篇
前言 提要
我们这个项目框架选择图表主要涉及三个方面
- 插件体积
- 兼容性
- 文档是否健全,用法是否简单易学
在此,我比较推荐 LimeUi,这是一个基本兼容全端的组件库,主要是图表组件
因为 limeUi 对 Echarts、Antv F2 等图表做了兼容处理,从而能在 uniapp 中使用
我们这篇文章就主要来介绍,如何使用这个组件库来引入百度图表,并且进行进一步封装
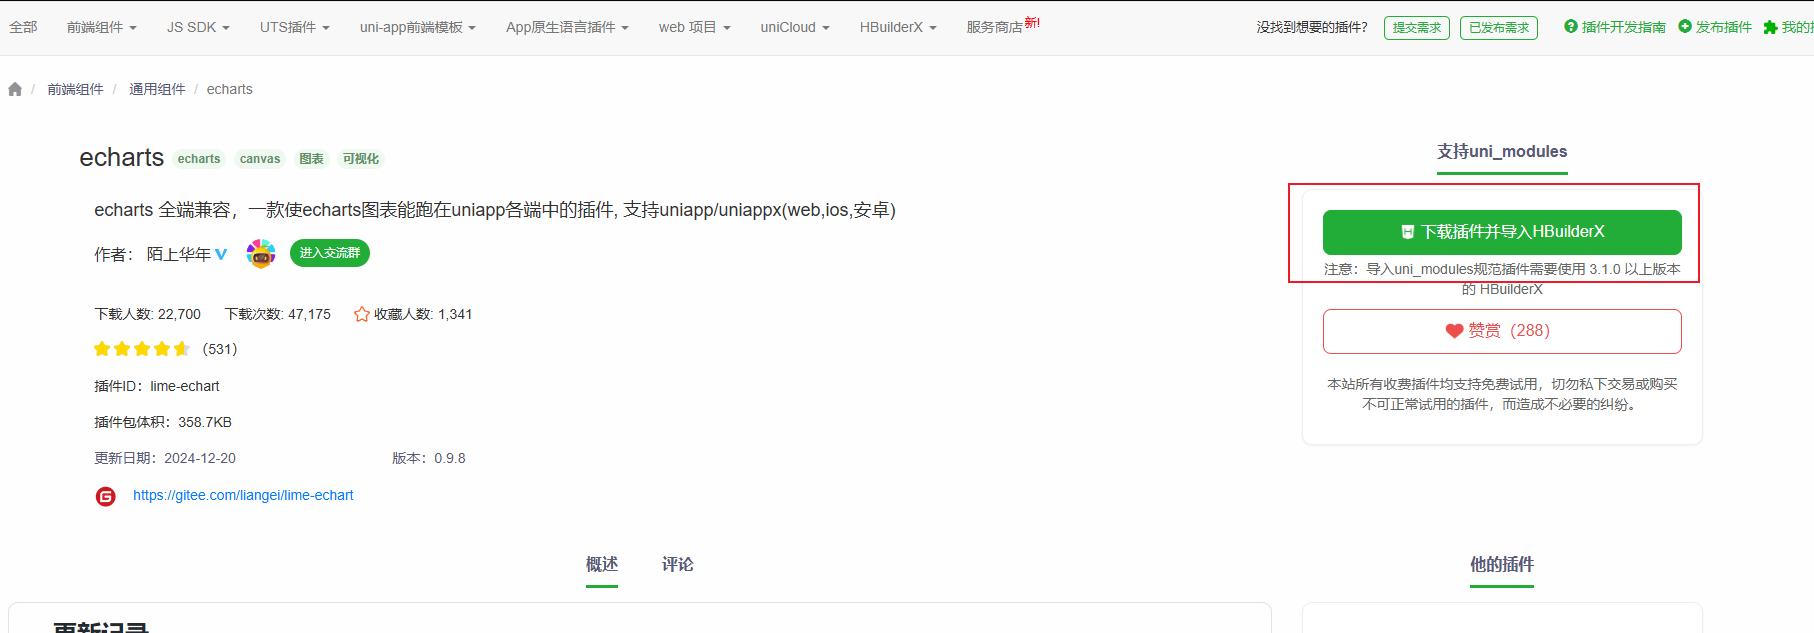
安装 Echarts
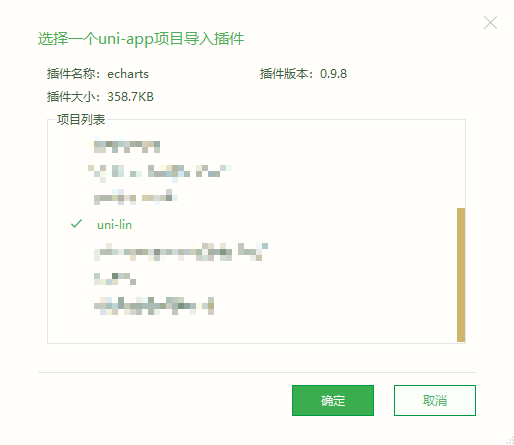
在插件市场中导入 百度图表兼容插件

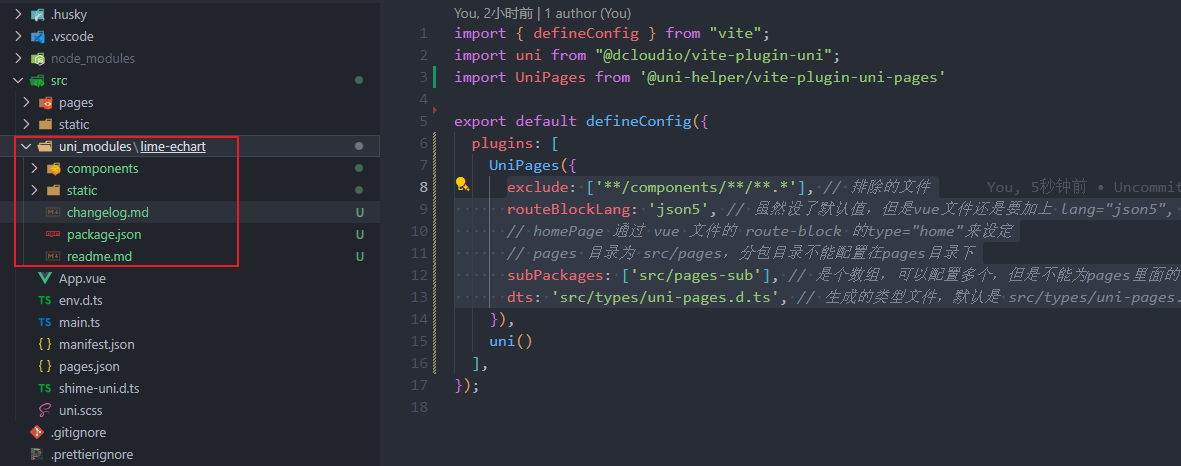
可以看到在 src 目录下多了 uni_modules 文件夹,并且已经引入了 lime-echart 插件
需要支持非小程序的,还需要安装 echarts
pnpm add echarts【注意】
- 🔔 必须使用hbuilderx 3.4.8-alpha及以上
- 🔔 echarts 5.3.0及以上
封装 Hooks
我们先来看一下,百度图表兼容插件是如何使用的,只讲 Vue3 部分,因为使用方式其实大差不差,可以触类旁通
在 .vue 文件的 <template> 中引入 l-echart
<template>
    <view style="width:300rpx; height:300rpx">
        <l-echart ref="chartRef" />
    </view>
</template>
根据不同环境在 <script setup lang='ts'> 导入 echarts
// 小程序 二选一
// 插件内的 二选一
const echarts = require('../../uni_modules/lime-echart/static/echarts.min');
// 自定义的 二选一 下载后放入项目的路径
const echarts = require('xxx/xxx/echarts');

//~~~~~~~~~~~~~~~~~~~~~~~~~~~~~~~~~~~~~~~~~~~~~~~~~~~
// 非小程序
// 需要在控制台 输入命令:npm install echarts
import * as echarts from 'echarts'
最后是调用,主要是配置 echarts 参数 与 获取 l-echart 实例并渲染
const chartRef = ref(null)
const option = {
    tooltip: {
        trigger: 'axis',
        axisPointer: {
            type: 'shadow'
        },
        confine: true
    },
    legend: {
        data: ['热度', '正面', '负面']
    },
    grid: {
        left: 20,
        right: 20,
        bottom: 15,
        top: 40,
        containLabel: true
    },
    xAxis: [
        {
            type: 'value',
            axisLine: {
                lineStyle: {
                    color: '#999999'
                }
            },
            axisLabel: {
                color: '#666666'
            }
        }
    ],
    yAxis: [
        {
            type: 'category',
            axisTick: { show: false },
            data: ['汽车之家', '今日头条', '百度贴吧', '一点资讯', '微信', '微博', '知乎'],
            axisLine: {
                lineStyle: {
                    color: '#999999'
                }
            },
            axisLabel: {
                color: '#666666'
            }
        }
    ],
    series: [
        {
            name: '热度',
            type: 'bar',
            label: {
                normal: {
                    show: true,
                    position: 'inside'
                }
            },
            data: [300, 270, 340, 344, 300, 320, 310],
        },
        {
            name: '正面',
            type: 'bar',
            stack: '总量',
            label: {
                normal: {
                    show: true
                }
            },
            data: [120, 102, 141, 174, 190, 250, 220]
        },
        {
            name: '负面',
            type: 'bar',
            stack: '总量',
            label: {
                normal: {
                    show: true,
                    position: 'left'
                }
            },
            data: [-20, -32, -21, -34, -90, -130, -110]
        }
    ]
};

onMounted( ()=>{
    // 组件能被调用必须是组件的节点已经被渲染到页面上
    setTimeout(async()=>{
        if(!chartRef.value) return
        const myChart = await chartRef.value.init(echarts)
        myChart.setOption(option)
    },300)
})
可以看到,使用难度并不大,但是明显可以看出 echarts 参数配置过多了,如果一个两个还好,要是有 6个 以上可能代码就很难阅读
所以,不建议直接在 .vue 文件中直接编写 Echarts 图表,因为实在太多东西了,可能你就几个图表,但是代码已经一大**了
那该怎么做呢?我的建议是:绘制图表的大多数配置我们新建一个 ts 文件进行维护,.vue 文件只处理数据部分
对此,我们可以通过自定义 hooks 思想来封装
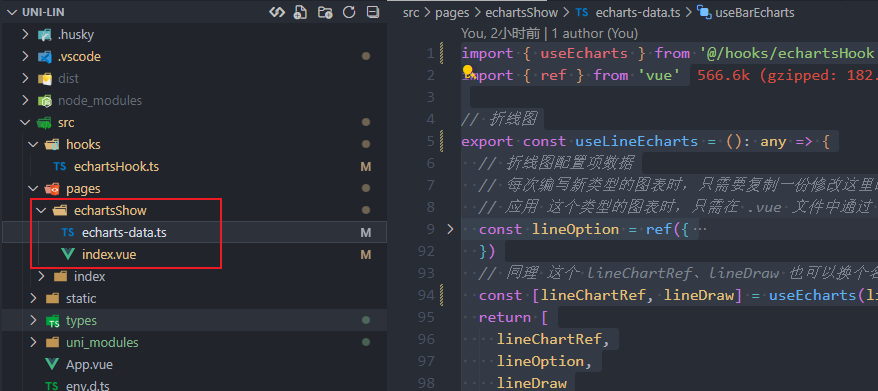
在 src/pages/echartsShow 目录下创建 echarts-data.ts 并写一个渲染 "折线图" 的 hooks
const echarts = require('../../uni_modules/lime-echart/static/echarts.min')
import { ref } from 'vue'
// 折线图
export const useLineEcharts = (): any => {
// 折线图的实例
const lineChartRef = ref(null)
// 折线图配置项数据
const lineOption = ref({
xAxis: {
data: [12, 13, 10, 13, 9, 23, 21, 32, 12, 15, 13, 10],
boundaryGap: false,
axisTick: {
show: false
},
axisLine: {
show: true,
lineStyle: {
color: "#0C4787"
}
},
axisLabel: {
show: true,
color: '#000000'
}
},
grid: {
left: 5,
right: 16,
bottom: 5,
top: 20,
containLabel: true
},
tooltip: {
trigger: 'axis',
axisPointer: {
type: 'cross'
},
padding: [5, 10]
},
yAxis: {
axisTick: {
show: false
},
splitLine: {
show: false
},
axisLine: {
show: true,
lineStyle: {
color: "#0C4787"
}
},
axisLabel: {
show: true,
color: '#000000'
}
},
series: {
smooth: true,
type: 'line',
data: [12, 13, 10, 13, 9, 23, 21, 32, 12, 15, 13, 10],
animationDuration: 2800,
animationEasing: 'cubicInOut',
symbol: 'circle',
color: "#fed42b",
symbolSize: 8,
lineStyle: {
color: '#fed42b', //改变折线颜色
},
areaStyle: {
color: {
type: 'linear',
x: 0,
y: 0,
x2: 0,
y2: 1,
colorStops: [
{
offset: 0,
color: '#fed42b', // 0% 处的颜色
},
{
offset: 1,
color: 'rgba(254, 212, 43, 0.1)', // 100% 处的颜色
},
],
global: false, // 缺省为 false
},
},
}
})
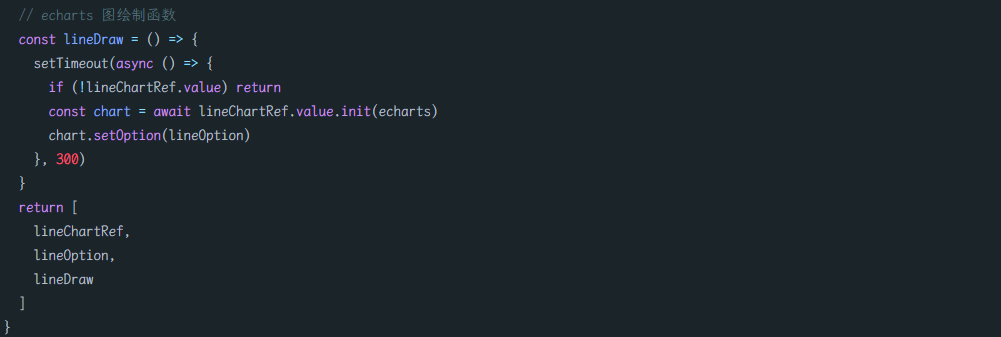
// echarts 图绘制函数
const lineDraw = () => {
setTimeout(async () => {
if (!lineChartRef.value) return
const chart = await lineChartRef.value.init(echarts)
chart.setOption(lineOption)
}, 300)
}
return [
lineChartRef,
lineOption,
lineDraw
]
}上面的自定义 hooks 其实很简单,就是定义两个变量、一个函数
lineChartRef用于<l-echart>绑定ref获取实例lineOption用于配置echats参数lineDraw初始化并渲染
封装自定义 hooks 约定俗成使用 use 作为函数名的开头
并且需要注意的是,很多人不知道 hooks 与 utils 的区别,把 hooks 与 utils 写混了
utils函数:不涉及响应式的函数Vue3自定义Hooks:涉及Vue3的一些响应式api,比如ref、reactive、computed、watch、onMounted
上面的 hooks 最妙的就是最后的返回,返回是一个数组,那为什么不能返回一个对象呢?
因为返回一个对象,返回名就是固定(虽然可以再自定义,但是麻烦),如果你返回一个数组,只需要注意顺序,名字随便定,而且容易复用
const [state, setState] = useState(initialState)用过 react 的小伙伴一定使用过 useState 这个 hooks,它就是返回一个数组,这样讲是不是好理解多了
**【进一步优化】**初始化与渲染函数、图表实例是不是可以再精简,怎么改进呢?
可以定义一个公共 hooks 来处理绘制函数、图表实例
 `
`
// echartsHook.ts
// 小程序中引入 echarts
const echarts = require('../uni_modules/lime-echart/static/echarts.min')
// APP 引入 echarts
// import * as echarts from 'echarts'

import { ref } from 'vue'

// echarts 图表 Hook
export const useEcharts = (options): any => {
  // echarts 图实例
  const chartRef = ref(null)
  // echarts 图绘制函数
  const draw = () => {
    setTimeout(async () => {
      if (!chartRef.value) return
      const chart = await chartRef.value.init(echarts)
      chart.setOption(options.value)
    }, 300)
  }
  // 这里就封装巧妙之处,如果是对象,那么需要重命名,而是是数组,无需重命名
  return [
    chartRef,
    options,
    draw
  ]
}
我们把 options 当作一个参数传入公共 hooks,这样 echarts-data.ts 也就只需要处理 option ,而且最后,导出也只需导出 useEcharts(option) 即可
这样做的好处就是,以后要是需要修改渲染函数,只需要改公共部分就可以了
// echarts-data.ts
import { useEcharts } from '@/hooks/echartsHook'
import { ref } from 'vue'
// 折线图
export const useLineEcharts = (): any => {
// 折线图配置项数据
// 每次编写新类型的图表时,只需要复制一份修改这里的配置即可
// 应用 这个类型的图表时,只需在 .vue 文件中通过 set 修复数据即可,或者简单的样式修改,如果样式过于复杂,可以重新建立一个 linkHookB 等等
const option = ref({
xAxis: {
data: [12, 13, 10, 13, 9, 23, 21, 32, 12, 15, 13, 10],
boundaryGap: false,
axisTick: {
show: false
},
axisLine: {
show: true,
lineStyle: {
color: "#0C4787"
}
},
axisLabel: {
show: true,
color: '#000000'
}
},
grid: {
left: 5,
right: 16,
bottom: 5,
top: 20,
containLabel: true
},
tooltip: {
trigger: 'axis',
axisPointer: {
type: 'cross'
},
padding: [5, 10]
},
yAxis: {
axisTick: {
show: false
},
splitLine: {
show: false
},
axisLine: {
show: true,
lineStyle: {
color: "#0C4787"
}
},
axisLabel: {
show: true,
color: '#000000'
}
},
series: {
smooth: true,
type: 'line',
data: [12, 13, 10, 13, 9, 23, 21, 32, 12, 15, 13, 10],
animationDuration: 2800,
animationEasing: 'cubicInOut',
symbol: 'circle',
color: "#fed42b",
symbolSize: 8,
lineStyle: {
color: '#fed42b', //改变折线颜色
},
areaStyle: {
color: {
type: 'linear',
x: 0,
y: 0,
x2: 0,
y2: 1,
colorStops: [
{
offset: 0,
color: '#fed42b', // 0% 处的颜色
},
{
offset: 1,
color: 'rgba(254, 212, 43, 0.1)', // 100% 处的颜色
},
],
global: false, // 缺省为 false
},
},
}
})
return useEcharts(option)
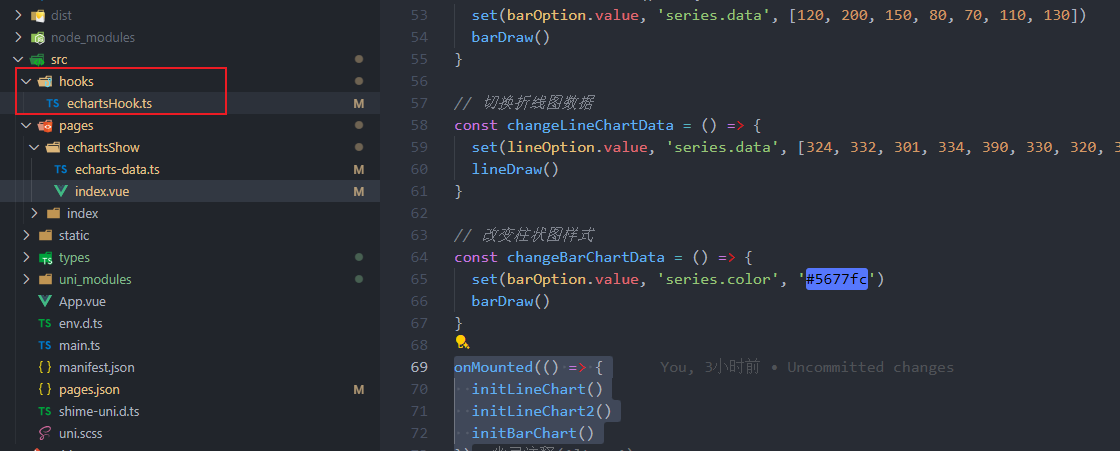
}使用 Hooks
我们来看下,如何调用这个 hooks
<!--
@description: Echarts 图表 dome
-->

<route type="home" lang="json">{
  "style": {
    "navigationBarTitleText": "图表 dome",
    "navigationBarTextStyle": "black",
    "navigationBarBackgroundColor": "#ffffff",
    "backgroundColor": "#ffffff"
  }
}</route>

<template>
  <view>折线图1</view>
  <view style="width:300rpx; height:300rpx">
    <l-echart ref="lineChartRef" />
  </view>
  <button @click="changeLineChartData">切换折线图1数据</button>
</template>

<script setup lang='ts'>
import { onMounted } from 'vue';
import { useBarEcharts } from './echarts-data';
import { set } from 'lodash-es'
// 使用 hooks 进行调用
const [ lineChartRef, lineOption, lineDraw ] = useLineEcharts()

// 初始化 折线图表1
const initLineChart = () => {
  lineDraw()
}

// 切换折线图数据
const changeLineChartData = () => {
  set(lineOption.value, 'series.data', [324, 332, 301, 334, 390, 330, 320, 302, 301, 334, 390, 330])
  lineDraw()
}

onMounted(() => {
  initLineChart()
})

</script>
如果你看到这个 <route> 有点懵,可以看到下 Layout篇
const [ lineChartRef, lineOption, lineDraw ] = useLineEcharts()我们使用了自定义 hooks 使用起来是不是清爽多了,只需要调用 useLineEcharts,就把 <l-echart ref="lineChartRef" /> 绑定了
set(lineOption.value, 'series.data', [324, 332, 301, 334, 390, 330, 320, 302, 301, 334, 390, 330])修改数据,推荐使用 lodash-es 中的 set 来编写,方便知道修改的是哪个结构的数据
这样封装的本质就是把 数据处理 与 复杂样式配置隔离开来,当然简单样式也是可以在数据处理这里修改,不必过于死板~
如果你想要继续加一个同类型的折线图,只是数据不一样,可以直接再调用 useLineEcharts,解构出来的名字换一下就可以
<view style="width:300rpx; height:300rpx">
 <l-echart ref="lineChartRef2" />
</view>const [ lineChartRef2, lineOption2, lineDraw2 ] = useLineEcharts()
// 初始化 折线图表2
const initLineChart2 = () => {
lineDraw2()
}
onMounted(() => {
initLineChart2()
})如果要多一种图表,比如 柱状图,在 echarts-data.ts 导出一个新 hooks 改下 option 的内容,调用方式还是其他的一样
// echarts-data.ts
export const useBarEcharts = (): any => {
  const option = ref({
    xAxis: {
      data: ['Mon', 'Tue', 'Wed', 'Thu', 'Fri', 'Sat', 'Sun'],
      axisTick: {
        show: false
      },
      axisLine: {
        show: true,
        lineStyle: {
          color: "#0C4787"
        }
      },
      axisLabel: {
        show: true,
        color: '#000000'
      }
    },
    grid: {
      left: 5,
      right: 16,
      bottom: 5,
      top: 20,
      containLabel: true
    },
    tooltip: {
      trigger: 'axis',
      axisPointer: {
        type: 'cross'
      },
      padding: [5, 10]
    },
    yAxis: {
      axisTick: {
        show: false
      },
      splitLine: {
        show: false
      },
      axisLine: {
        show: true,
        lineStyle: {
          color: "#0C4787"
        }
      },
      axisLabel: {
        show: true,
        color: '#000000'
      }
    },
    series: {
      type: 'bar',
      data: [120, 200, 150, 80, 70, 110, 130],
      animationDuration: 2800,
      animationEasing: 'cubicInOut',
      color: "#fed42b",
      barWidth: 10,
      itemStyle: {
        barBorderRadius: [3, 3, 0, 0]
      }
    }
  })
  return useEcharts(option)
}<view style="width:300rpx; height:300rpx">
<l-echart ref="barChartRef" />
</view>const [ barChartRef, barOption, barDraw] = useBarEcharts()
// 初始化 柱状图表
const initBarChart = () => {
// set(barOption.value, 'series.data', [120, 200, 150, 80, 70, 110, 130])
barDraw()
}
onMounted(() => {
initBarChart()
})总结
uniapp 要使用 echarts 等图库,得使用第三方插件实现,比如 LimeUi 的百度图表插件
echarts 的配置参数太多了,都写在 .vue 中影响维护与阅读,所有把数据与样式分层,建立 echarts-data.ts 维护样式层
数据处理就写 .vue 中即可
注意自定义 hooks 函数要以 use 开头,并且注意 utils 与 hooks 的区别
utils函数:不涉及响应式的函数Vue3自定义Hooks:涉及Vue3的一些响应式api,比如ref、reactive、computed、watch、onMounted
还提到,hooks 函数返回数组是为了更好的复用
hooks 中有很多类似的地方,可以适当的抽离成一个公共 hooks,进行引用,以后修改的时候,也不必所有图表 hooks 都改一遍